This post is adapted from a notebook designed to help you learn how to make apps in Panel in about 15 minutes. Screenshots of cell outputs are included for convenience below, but it is strongly recommended that you use the interactive Binder version (takes 1-2 minutes to load) or clone the repo to run the demo locally.
Panel is a open-source Python library that makes it easy to build interactive web apps and dashboards with flexible user-defined widgets. The Panel library makes a broad range of widgets available. However, did you know that you can also use widgets from the ipywidgets library with Panel seamlessly?
What Are Widgets?
For our purposes, a widget is a component of a graphical user interface (GUI) that enables easy interaction with the application (e.g., a drop-down menu for selecting from a set of items or a slider for specifying a numeric value). Until recently, GUI authors had to choose between strictly using Panel or strictly using ipywidgets because each ecosystem had distinct widget patterns; fortunately, that is no longer the case. The union of these ecosystems opens up enormous possibilities for designing flexible GUIs (both in notebooks and in web applications).
Panel and ipywidgets Demonstration
We’ll show you an example in this notebook that uses widgets from ipywidgets within a Panel app. We are going to modify an example Panel app for exploring the autompg dataset included with the Bokeh package by switching out the Panel.ColorPicker widget with the ipywidgets.ColorPicker widget. Just for fun, we’ll also add in widgets from ipywidgets to change the size and shape of the markers in a scatter plot.
					import hvplot.pandas, panel, ipywidgets
from bokeh.sampledata.autompg import autompg

panel.extension()
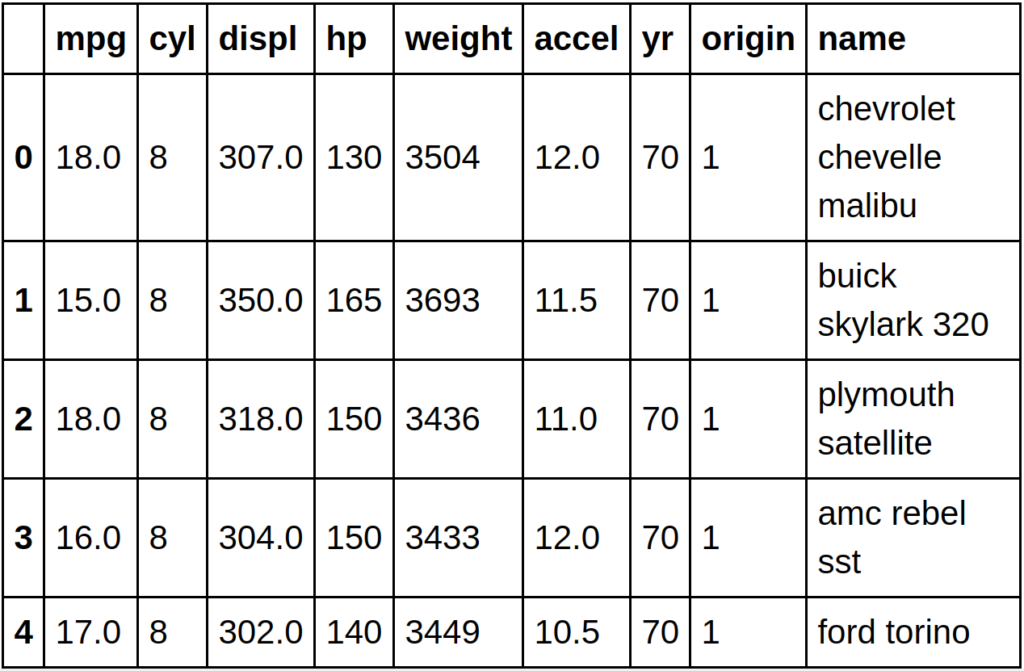
autompg is a pandas DataFrame, so we can sample a few leading rows to see what the columns are:
autompg.head()
Widgets With Panel and hvPlot
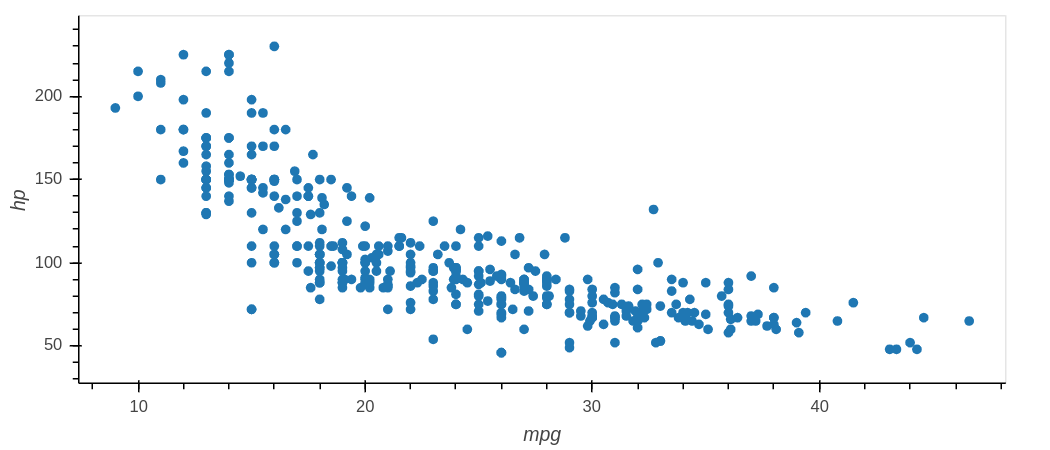
The hvplot accessor enables simple ways to produce plots from the autompg dataframe. For instance, we can make a scatter plot using the mpg and hp features. We’ll use the resulting plot as a template to develop a GUI for exploring the autompg dataset.
autompg.hvplot.scatter("mpg", "hp")
First, let’s define a few Panel widgets to manipulate the preceding plot. The Select widgets x_col and y_col are drop-down menus to select numerical columns from the autompg dataframe for the horizontal and vertical axes of a scatter plot.
					# Define keyword argument 'options' for both Select widgets
cols = autompg.columns
opts = {"options": list(cols.drop(["origin", "name"]))}
print(opts)
We can now connect all the widget objects instantiated so far. In particular, the decorated function autompg_plot combines the Panel Select objects x_col and y_col together with the ipywidgets objects color, size, and marker to construct an explicit call to autompg.hvplot.scatter.
For context, the Panel.depends decorator wrapping autompg_plot produces a function that is revaluated whenever any of the specified widget objects (x_col, y_col, color, size, and marker) are changed by the user. As such, the resulting scatter plot is updated too.
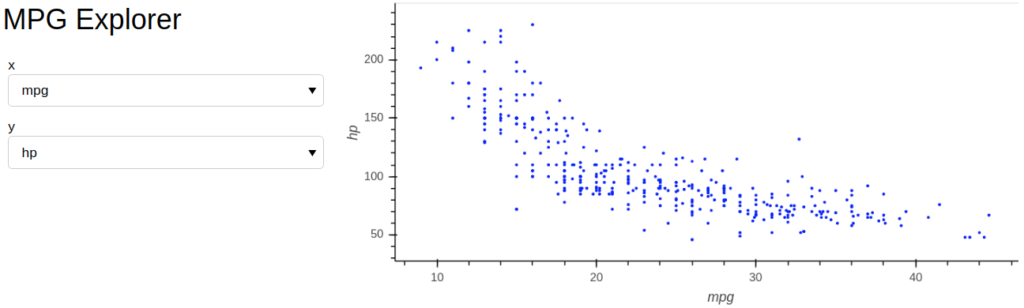
Finally, we can create a useful Panel app layout for the application. With the objects Panel.Row and Panel.Column nested as below, we will have a single row composed of a column of widgets on the left and the associated scatter plot on the right. More specifically, from top to bottom, the left-hand column has Markdown text at the top, two drop-down menus beneath, then a color picker, a slider, and finally another drop-down menu at the bottom. Notice again that the Panel application combines widgets from both the ipywidgets and the Panel ecosystems.
When building a Panel app or dashboard, embedding widgets from ipywidgets is just as simple as using Panel widgets only! This greatly broadens the number of widgets and different styling options available.