“You may be able to spin up a GPU server easily (some companies do this), but they may make you do all your work on that GPU server. This makes no sense because when you're coding, 90% of the time, you're thinking about the problem, writing the problem, and graphing the solution - why would you want a GPU running while you're doing all that? You only want the GPU running to do the GPU stuff. The rest of the time, you can use a smaller CPU instance.”
Dharhas Pothina, Quansight CTO
Determining the most efficient cloud hardware for training, evaluating, or deploying a deep learning model can be time-consuming, and if the model runs on poorly chosen resources, the cost can be high. Historically, benchmarking AI model computational performance required sophisticated infrastructure or expensive SAAS products, which are often out of reach for teams without dedicated DevOps expertise or deep pockets.
Graphics Processing Units (GPUs) have become increasingly expensive and difficult to obtain, particularly in cloud environments. With the rise of AI applications like OpenAI’s ChatGPT, demand for powerful GPUs such as a100s and h100s has surged, making them even more costly. At Quansight, we work with clients who face challenges accessing these high-end GPUs on platforms like Amazon Web Services and Google Cloud Platform (GCP).
It’s important to recognize that not all models and workflows require the most powerful GPUs. Depending on your specific needs and time constraints, more cost-effective alternatives may suffice. This article explores open source solutions for optimizing GPU workloads in the cloud and illustrates experiments conducted to determine the most suitable GPU for your tasks.
We will walk through a typical workflow, from initial experimentation in Jupyter to a pipeline running models on multiple GPU resources (via Argo Workflows) for evaluation of resource efficiency and code profiling, all with minimal code in Python. This workflow will be demonstrated on Nebari, a new open source data science platform that provides scalable CPU & GPU compute and common data science tools on the cloud of your choice with minimal cloud expertise.
“I will show you some open source solutions you can put together to either run your GPU workloads in the cloud or experiments you can do in the cloud to work out what GPU you need and then, when necessary, buy that GPU. Instead of saying you need an a100, so you’re going to buy an a100, only to discover you’re not using it and wasted a bunch of money, try these tools out and apply only the usage you need.”
Dharhas Pothina, Quansight CTO
To begin, let’s consider training a computer vision model. We can use PyTorch-Ignite for this, a higher-level library to PyTorch that’s designed for modularity and extensibility. Learn more in PyTorch-Ignite: training and evaluating neural networks flexibly and transparently. To quickly generate training scripts, you can use PyTorch-Ignite’s Code-Generator, a tool to create template scripts for common deep learning workflows.
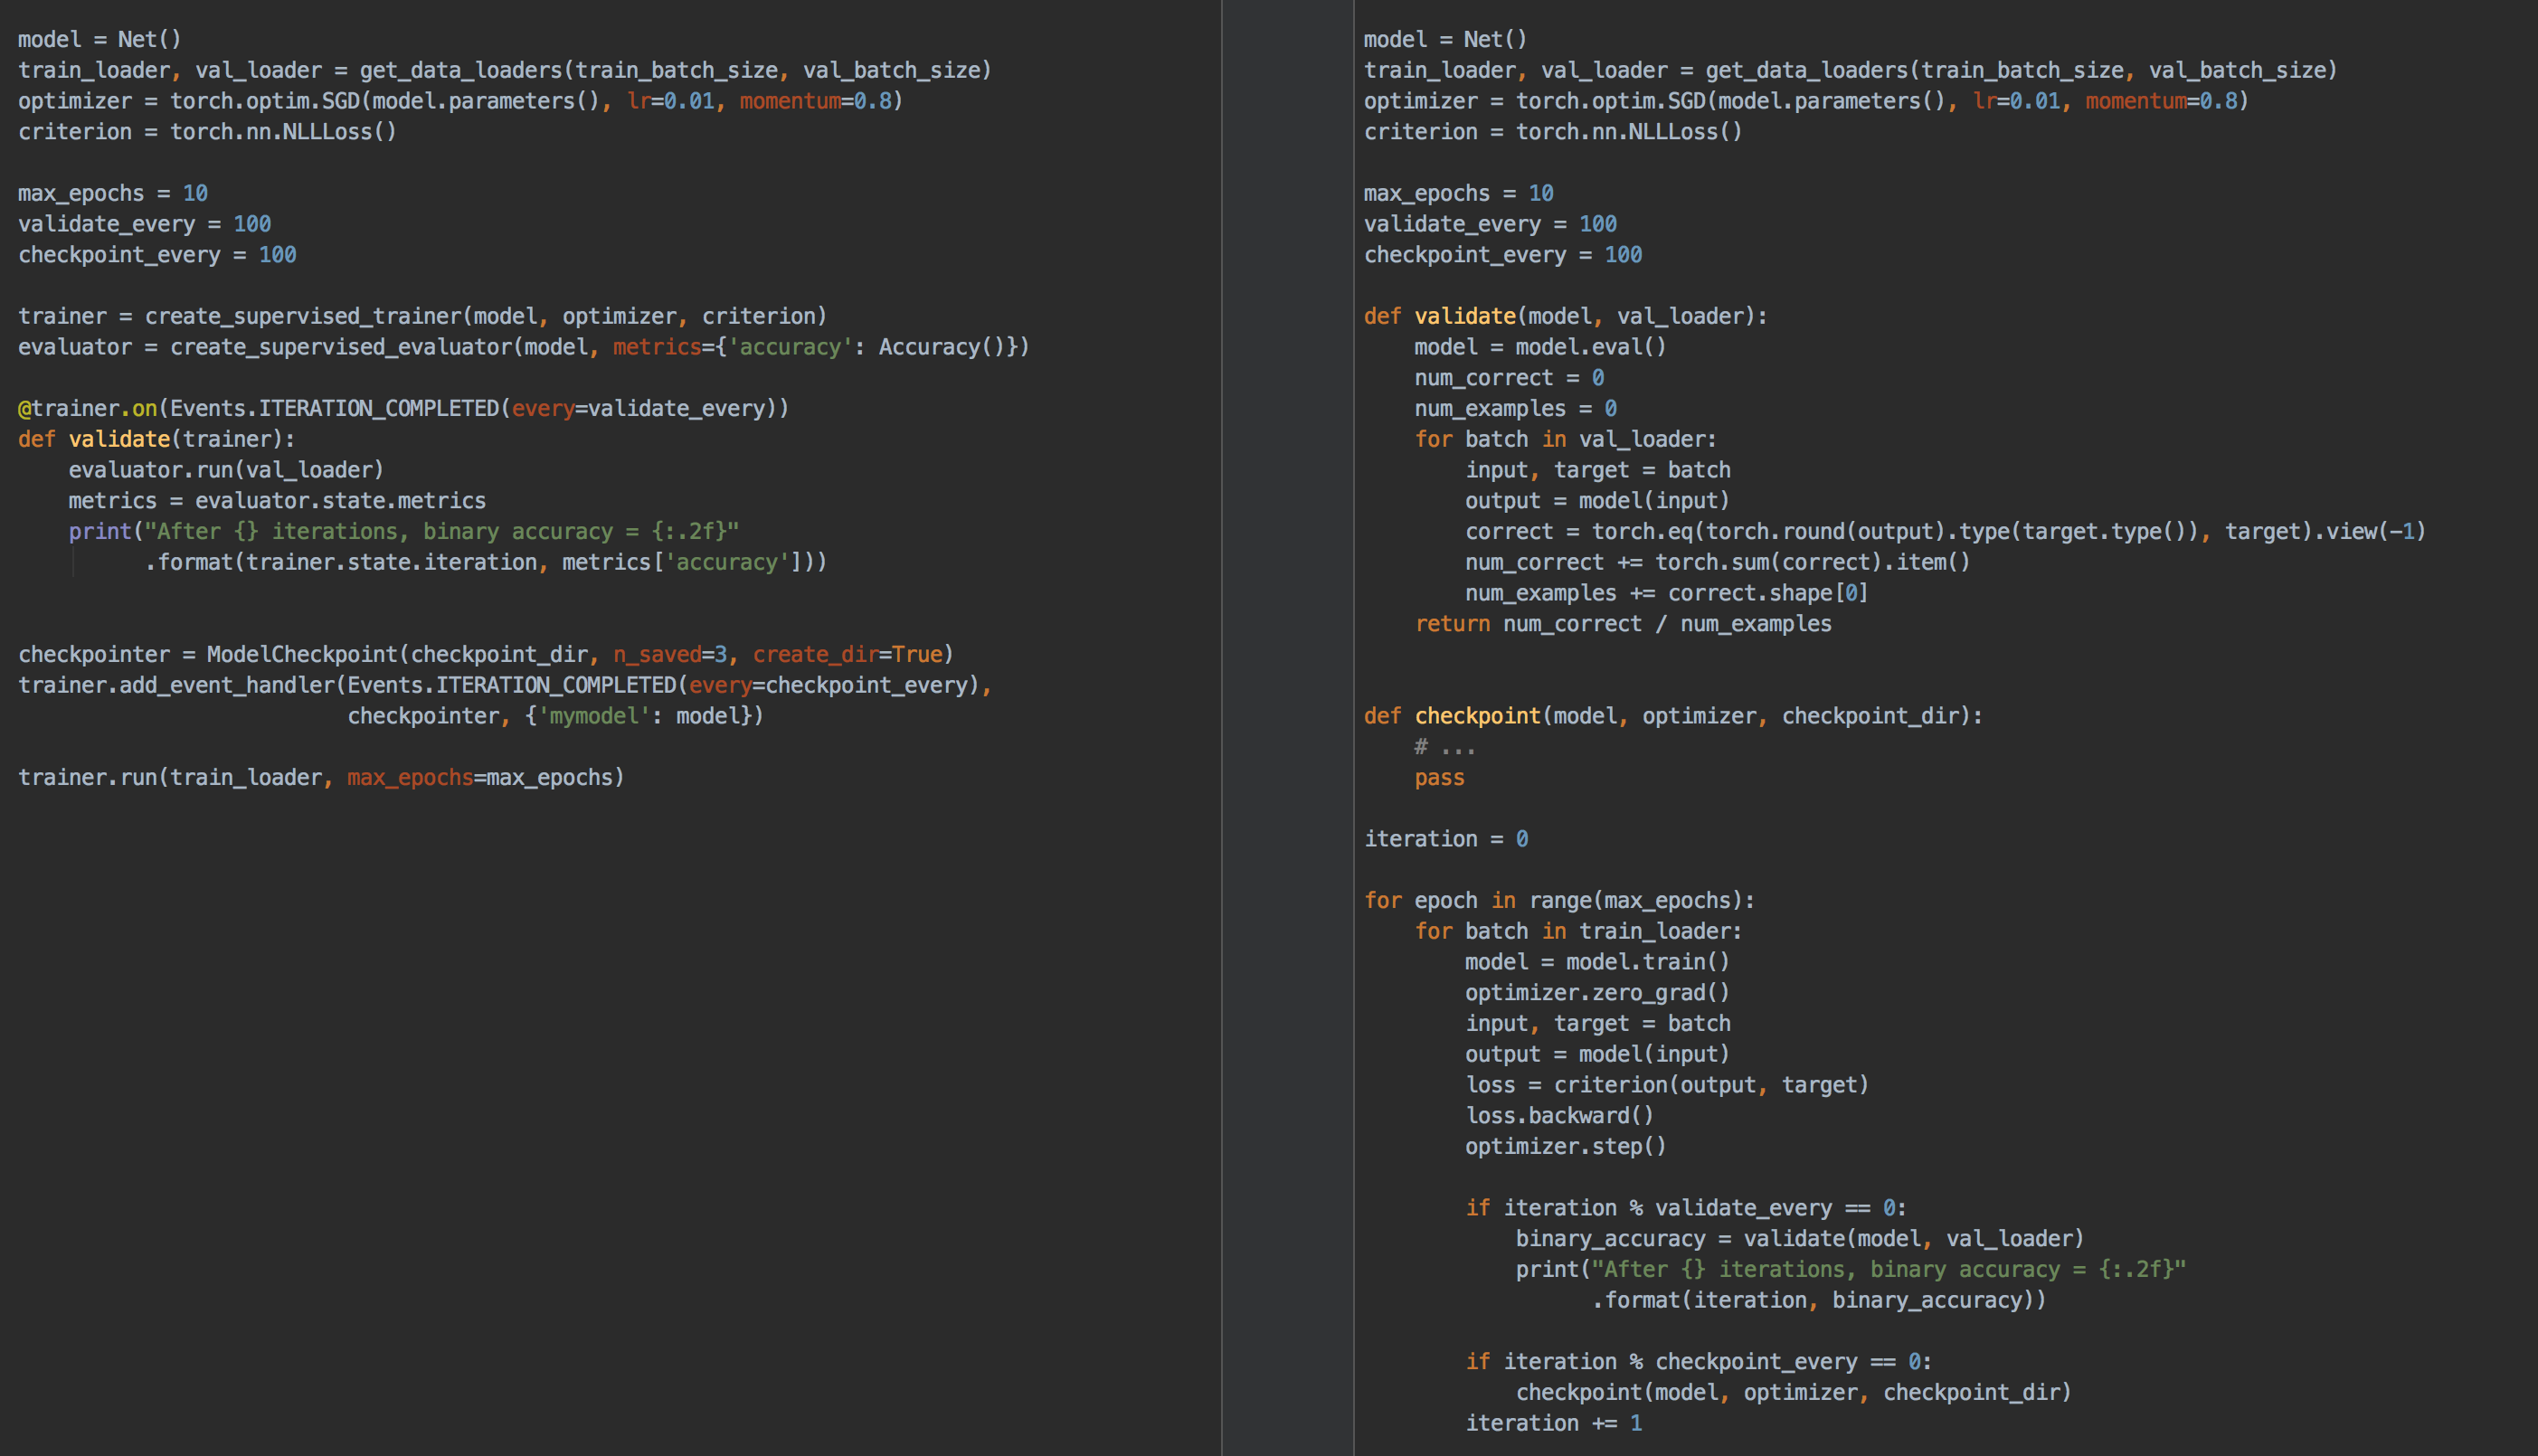
PyTorch Ignite(left) & PyTorch(right)
“PyTorch Ignite is nice because if you look at the amount of code you need for a regular neural network model in PyTorch, and then compare it to Pytorch Ignite, you can see it gives you a shorter code, yet it’s still deep enough that you can do reasonable things.”
Dharhas Pothina, Quansight CTO
You can then leverage Nebari, an open source data science platform developed at Quansight, to run it on the cloud. For example, you can run it on a K80 GPU instance on Google Cloud Platform (GCP).
Nebari is an opinionated distribution of JupyterHub. It provides a powerful environment management system with conda-store, and integrates essential tools like JupyterLab, VS Code, Dask, and more. Nebari simplifies the deployment setup process by providing pre-written Terraform scripts for various cloud platforms. With minimal configuration, you can deploy a cloud platform in about 30 minutes.
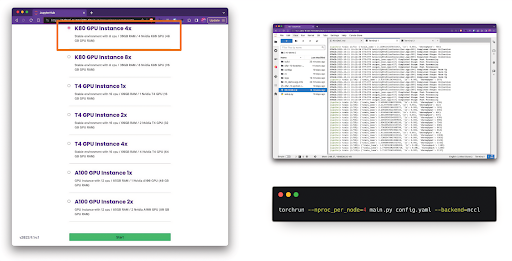
On Nebari, you can use the integrated NVDashboard, an open source JupyterLab extension, to monitor GPU utilization. For example, running a model on four K80 GPUs shows efficient utilization of all GPUs, indicating minimal memory constraints. In contrast, running the same model on an A100 (if available) might result in lower GPU utilization, highlighting potential inefficiencies and cost implications.
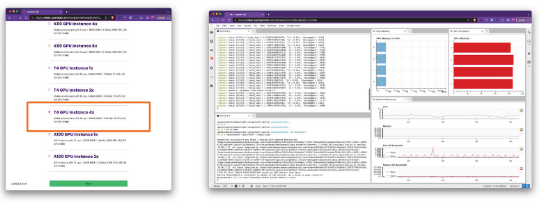
You can compare performance and cost-effectiveness by experimenting with different GPUs, such as the T4, and capturing metrics with Prometheus and Grafana. In this instance, the T4 demonstrated better throughput and lower costs than the K80 despite common assumptions favoring the K80. This highlights the importance of tailoring GPU selection to specific workloads and avoiding assumptions based on general recommendations.
“I'm running it on four K80s on GCP, using a tool called NVDashboard, an open source integration to Jupyter that lets you look at your GPU usage. If you look at the example [below], we're doing pretty good. We're not memory-limited. We're pegging all four GPUs pretty well. If I did this on an a100, which I did not do, because I couldn't get one (which is the case in point), you would see this GPU utilization would be a lot lower, therefore wasting GPU.”
Dharhas Pothina, Quansight CTO
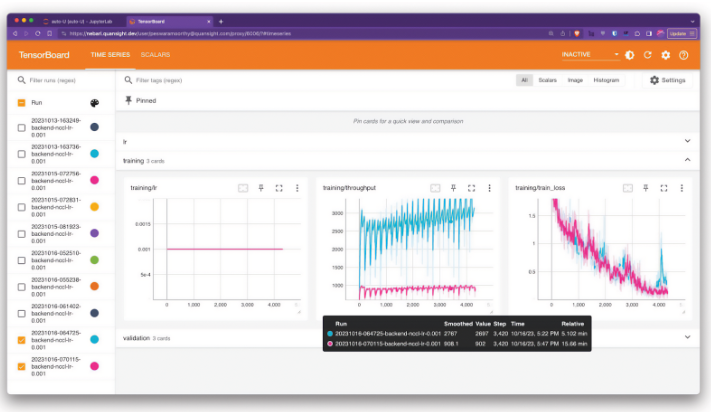
In addition to the tools mentioned, Tensorboard can be easily integrated into this framework. Initially designed for TensorFlow, Tensorboard is also compatible with PyTorch and serves as a powerful tool for profiling your modeling code. By using Tensorboard, you can gain in-depth insights into your model runs.
For instance, you might find surprising results when comparing the performance of different GPUs. In one scenario, the T4 GPU (BLUE) showed significantly better throughput (i.e., images/second) than the K80 (PINK), despite initial assumptions that the K80 would perform better. Interestingly, the T4 was also less expensive than the K80 on Google Cloud. This example highlights the importance of empirical testing rather than relying on preconceived notions about hardware performance.
Monitoring tools like Prometheus and Grafana that built-in to Nebari can also provide some valuable information about the utilization and effectiveness of different hardware resource.
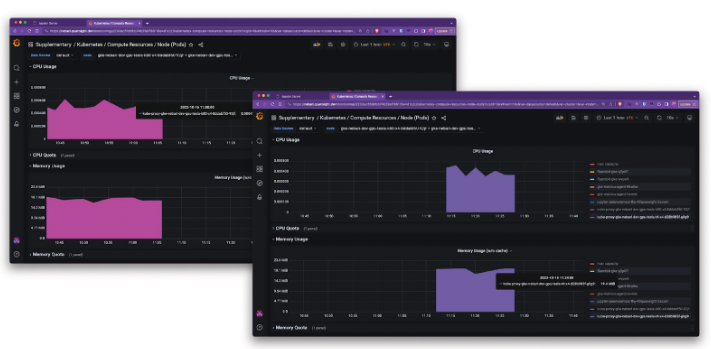
There are other tools, like Dask and other open source solutions, that can help you manage GPU resources more effectively. These tools allow for auto-scaling of GPUs, enabling you to spin them up or down as needed while conducting the majority of your work on smaller instances. This approach not only optimizes resource usage but also reduces costs.
Once you have deployed these tools and have access to various GPUs, you can use workflow engines like Argo Workflows, Prefect, or Flyte to orchestrate your experiments. You can collect and analyze performance data by running your models on different GPUs and hardware types. This data-driven approach empowers you to make informed decisions about the most suitable hardware for your specific use cases, ensuring efficiency and cost-effectiveness.
“All the tools needed to explore computational performance are available in the open source ecosystem. By combining these tools, we will show how to easily run computational performance tests across a range of cloud GPU resources for deep learning models, such as fine-tuning large language models (LLMs), to assess code quality and determine optimal resource usage.”
Dharhas Pothina, Quansight CTO
Additionally, acquiring certain GPUs like the Aa100 with substantial RAM on Google Cloud can be challenging, as they are often bundled with additional resources you may not need. This bundling can lead to unnecessary costs. Therefore, it is wise to evaluate the specific requirements of your workflows rather than defaulting to high-end GPUs like the Aa100 or Hh100 solely based on their reputation.
Another consideration is the practical usage of GPU servers in cloud environments. While it is possible to spin up GPU servers, using them for tasks that do not require intensive computation is inefficient. Most coding activities, such as problem-solving, writing code, and visualization, do not necessitate constant GPU usage. Instead, you can utilize CPU instances for these tasks and reserve GPUs for computation-heavy operations. Nebari allows you to switch between different machine profiles with different sets of resources quickly without losing any ongoing work. At Quansight, we make the most of this features by having a range of machine types available for our team.
“All the tools needed to explore computational performance are available in the open source ecosystem. By combining these tools, we will show how to easily run computational performance tests across a range of cloud GPU resources for deep learning models, such as fine-tuning large language models (LLMs), to assess code quality and determine optimal resource usage.”
Dharhas Pothina, Quansight CTO
Several open source tools and frameworks can help you assess and optimize your GPU needs. Nebari, for example, offers a streamlined deployment process and serves as a reference architecture for integrating various tools into your enterprise stack. Rather than defaulting to high-end GPUs like the A100 or H100, it is smart to evaluate your specific use case and select the most appropriate hardware.
Ultimately, while cloud resources offer flexibility for experimentation, long-term hardware investments may be necessary for sustained usage. By leveraging these tools and approaches, you can make informed decisions and maximize the efficiency of your AI workloads.
Dharhas Pothina is the CTO of Quansight, a company dedicated to open source Python development. Quansight employs many core developers of critical tools such as PyTorch, NumPy, and SciPy, which form the foundation of AI and machine learning (ML) technologies.
At Quansight, AI/ML Engineering consulting is a key benefit we offer to help companies navigate the evolving landscape of AI technology. By leveraging our expertise, we provide actionable insights into how businesses can maximize their AI capabilities.